Yesterday we looked at some of the more helpful sections of Google’s new My Business platform and how each of those sections could help you take control of your firm’s presence on Google. Check it out here if you missed it.
We left out the Insight section in that blog post. Google has been providing these insights, in some form or another, for a while now. In a way, it’s Google Webmaster Tools for Places. Insights provide some interesting data: how many people clicked for driving directions, how many people saw your listing, etc. Even with these stats, most Internet marketing reporting and strategy seems to discount the value of such information as just “Good to know”.
If you have been ignoring your Insights reports, be prepared to change. With the introduction of My Business Insights, Google has turned its redheaded stepchild into a full fledge member of the analytics family, allowing you to understand who is looking for you and how best to communicate with them.
Window into the Soul of Your Business
I read a blog post recently that said all business goals boil down to three “mother” goals: Win, Increase Revenue, Increase Profits. How do you accomplish any one of those three? Well, that’s a long post but the short version is by influencing people. Think about it: if you could know which customers were attracted to your brand, which messages would resonate with them, and how they preferred to connect with your brand, would you take advantage of that knowledge? Of course you would.
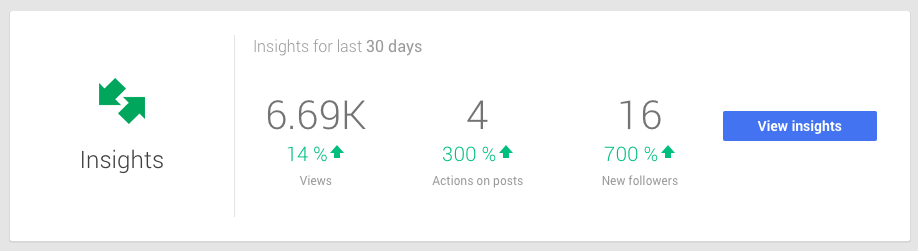
My Business Insights gives you all of this information and more. It gives you a snapshot of the people who have connected with your brand and lays out the clues to finding more people like them. The base section gives you a quick glance version of this. But the real magic happens when you click the View Insights button.
Through the Looking Glass
Once you click the button you are taken to the following screen:
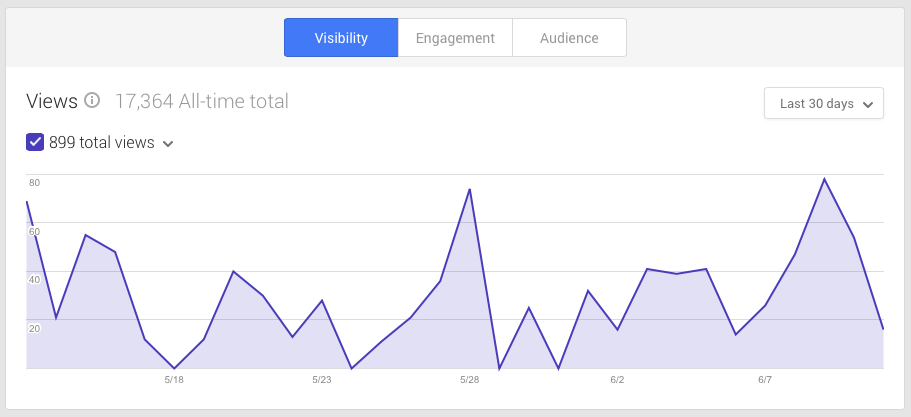
The visibility tab shows your Views, Your Clicks, and Your Driving Directions. Each of these windows can have their time frames changed from the last 30 days to the last 7 days, last 90 days, or all time.
Views
This shows you when people laid eyes on your listing. In the example above, Sundays tend to be a big day for us. Let’s break that down a bit. If we click the down arrow next to the 899 total views, we get the following view:
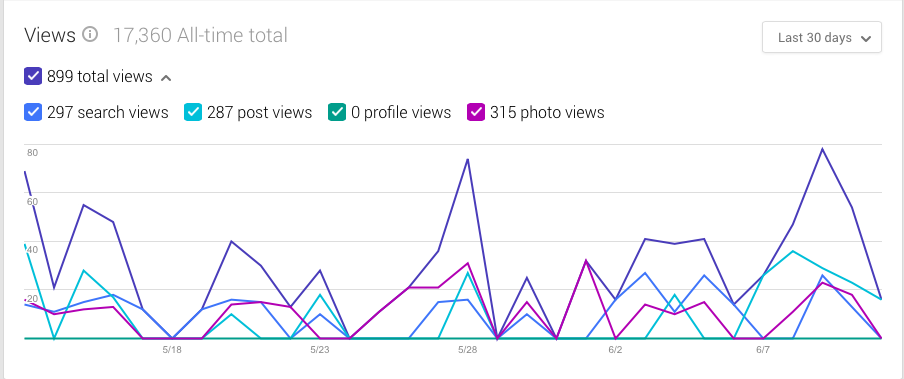
Not only can we see total views, but we can also see what those people viewed. This breakdown allows you to see which of your efforts are driving views. For this client, over the last 30 days, photos shared on our listing brought in the most views followed by search views in second place. Ok, first insight in our audience is that they like visuals. Duly noted.
Now, if I were posting a lot on this listing, I may want to just see how well my posts are connecting with my audience. Easy, click all the check marks next to the ones we don’t want to see, to view just one specific type of view.
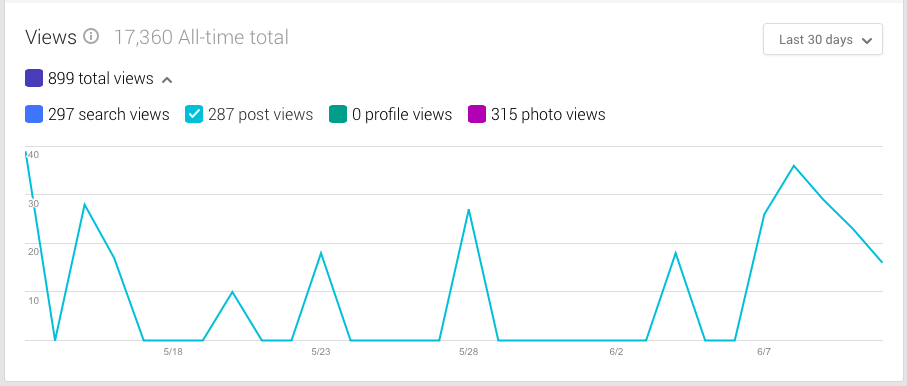
Based on of this graph I can see that the posts I share everyday are not having the market penetration I’m wanting. My Business Insights gives us more data on this (we’ll be chatting about a bit later), but for now I’m going to note that I may not be sharing the right kinds of posts.
Breaking down each type of view and giving us the ability to track each type, allows us to better understand what is happening with our business listing on a daily basis.
Clicks
If we think of Views as impressions (in Webmaster Tools lingo as least), the clicks are the ultimate goal. We want to be seen but we want to be loved, I mean, clicked on. Understanding when people click and what they click can help us put together a better strategy to getting more clicks.
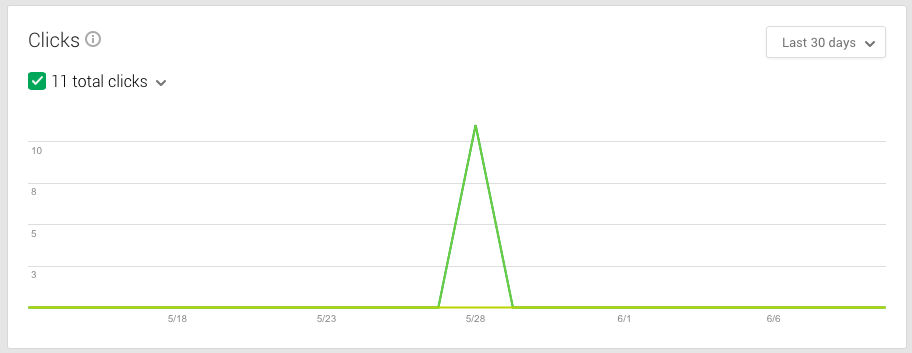
Talk about a blow to the stomach for this campaign. We had 899 total views, but only 11 clicks… We need to do something about that. We had all of our clicks in the last month on one day. Our starting point for duplicating that day would be to figure out what happened on that day. Did our rankings jump and then drop? Did we share an awesome piece of content on our listing page? Were we in the news? Whatever it is for your firm, find it and then put together a plan on how to recreate it.
Like the views graph, we can also see what people clicked on by clicking on the down arrow next to the total clicks.
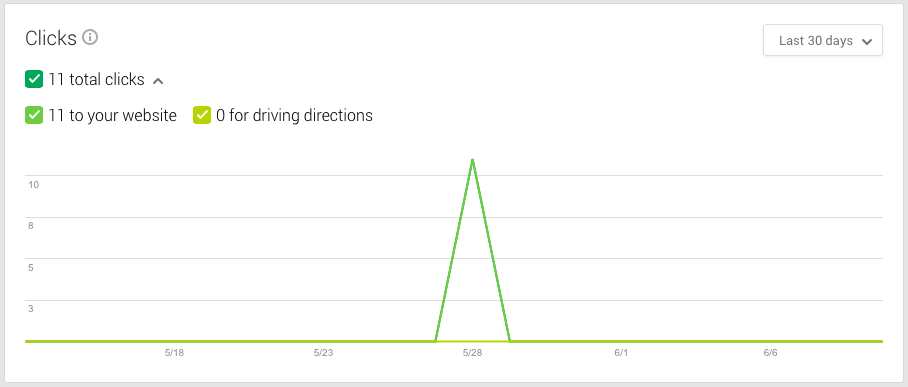
Good to know that no one is clicking for directions to our office. Although, in this example, no one is clicking to our website either, so we don’t have enough data to determine next steps beyond working to get more people to interact with our listing.
Driving Directions
This section is a bit different as it actually gives us information about our visitors instead of just numbers.
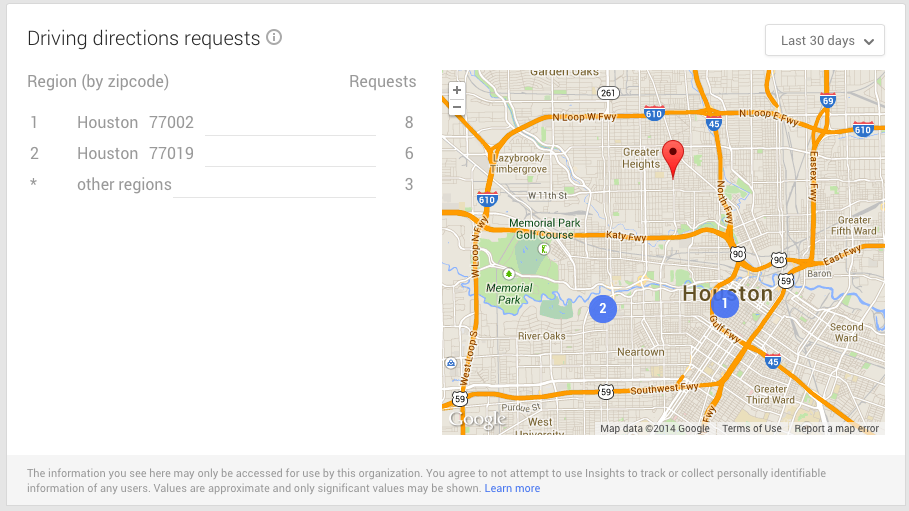
OK, that’s interesting. We know that no one clicked to get directions but we are seeing a total of 17 direction requests. How did that happen? This section pulls information from Google Maps. Meaning if you have a map embedded on your site or if someone found you via the Google Maps app, they will show up here.
Beyond knowing that people are finding us using the Google Maps app (which is my best guess as we are getting pretty specific geo-information like that provided by locations services on mobile phones), we also know that we are bringing in people from 2 specific zip codes. If I were this attorney (and I had 6 – 9 months of data supporting it) I would focus some of my offline marketing efforts in these zip codes.
The goal with all of these insights is to understand and leverage your current clients in order to get more like them. Knowing which zip code is bringing in the most potential clients (clients, by the way, wanting to know how to drive right to your front door) is very useful information.
There is one caveat to this information; all of these requests could be the same two people who are current clients. That’s why you should gather the data over time. I suggest you start a spreadsheet to record this data, as Insights will only provide you with the last 90 days. Once you have 6 months to a year, you should have a better idea of where your clients are coming from.
Care to be Engaged?
The engagement tab is where you can see how the tactics you have employed have affected your audience. In marketing terms, the visibility tab is brand exposure and the engagement tab is brand penetration.
Actions on Posts
Here’s the nitty gritty of your social marketing efforts on Google +. Did anyone do what we wanted with our posts?
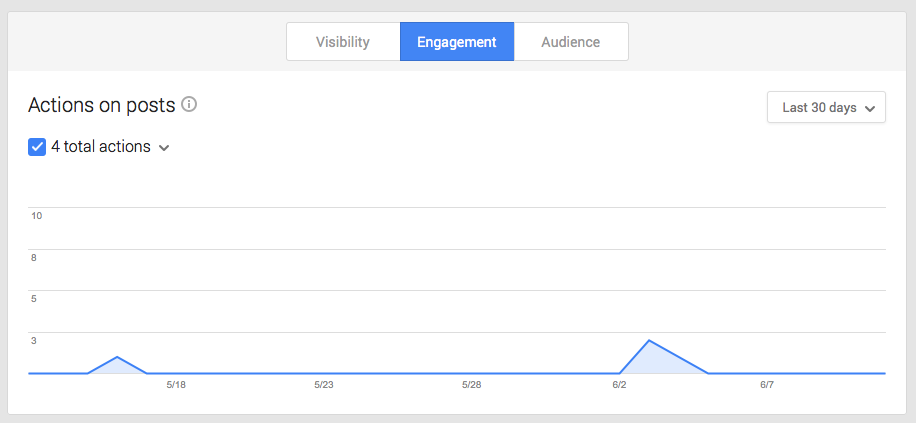
Four actions aren’t anything to brag about but at least some people are doing something. Again if we click the down arrow next to total actions, we can get more specific information.
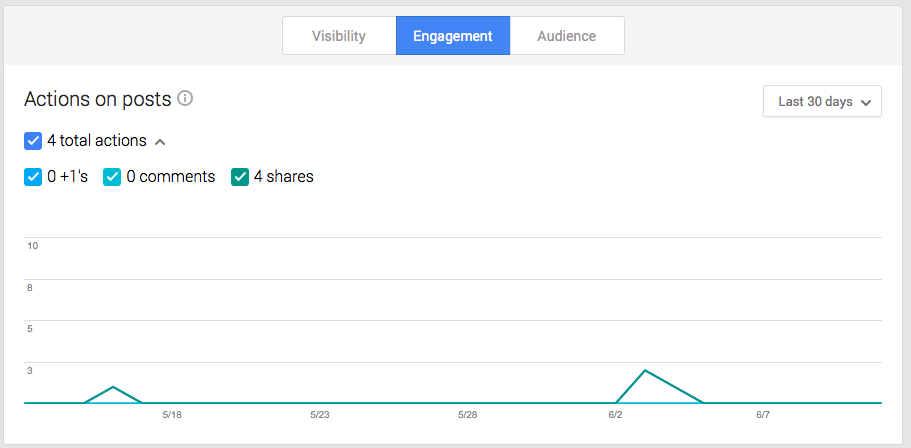
We got four shares. So what this tells us is that the current posts we are sharing on our page aren’t connecting with our users. We need to change our tactics if we want more brand interaction. But Insights gives more than just actions on our posts overall. It also shows us how each post did.
Recent Posts
With this section we get total actions as well as how people saw the post for each post we have shared. Depending on how many posts you share, you will have multiple pages of information.
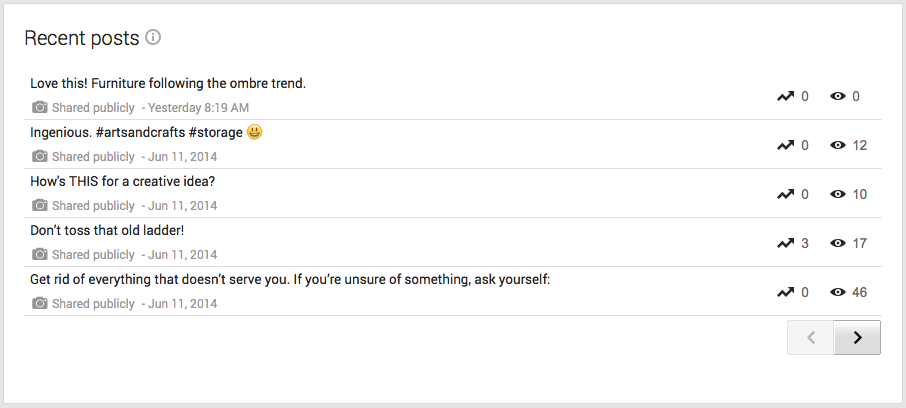
Now we are getting somewhere. We can start looking at each one of these posts and asking questions like “Why did the Get rid of everything post get seen by more people?” or “The ladder post got the most actions, how come?” Examining these posts and gathering data on each one, like what time they were shared, did one have more pictures than another, was a different topic for us, etc, will give better insight into what your audience likes. This will lead to more actions and more views (as they share things, their friends will see it) that will lead to more brand exposure.
Average Action By Post Type
We don’t have to gather all of that data on our own. My Business breaks it down for us.
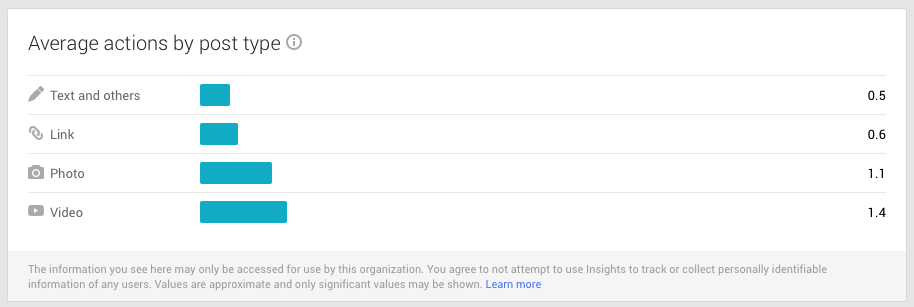
All right, our users like our videos most, followed by photos. Useful info but it would be even better if we could see what actions people took on each type.
Insights can provide that info for us if we just hover over one of the bars.
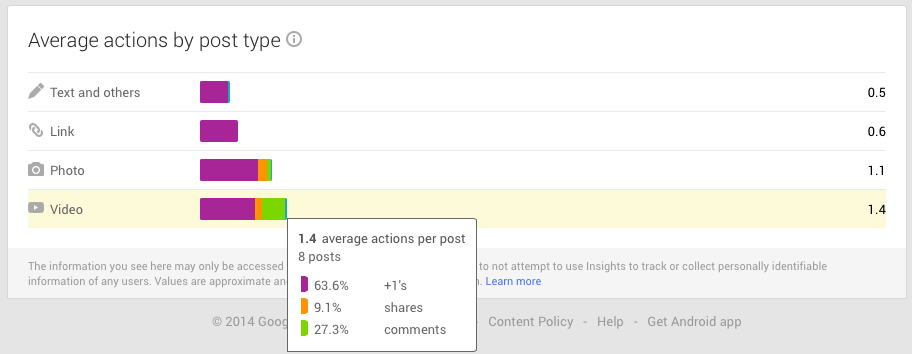
Awesome. Now we can compare our efforts to our goals and see how we are doing and what needs to change.
For this attorney, if our goal were comments, sharing videos and photos is going to be our best chance of getting them (without changing the type of information we share).
Overall the engagement section really helps you understand how your firm is interacting with its followers. You can then analyze and make better decisions about how to engage with them on this specific social channel.
Who’s On First?
Because Google + is a social network, we can get even more insight into the people who have interacted with our content. The audience section gives what country our followers are in as well as gender and age. Sadly, as the product just launched, this information has not yet populated for any of the locations we manage. Google says that in order to get this information you must have at least 200 followers.
However, the section that is working, at least in some degree, is the New Follower section.
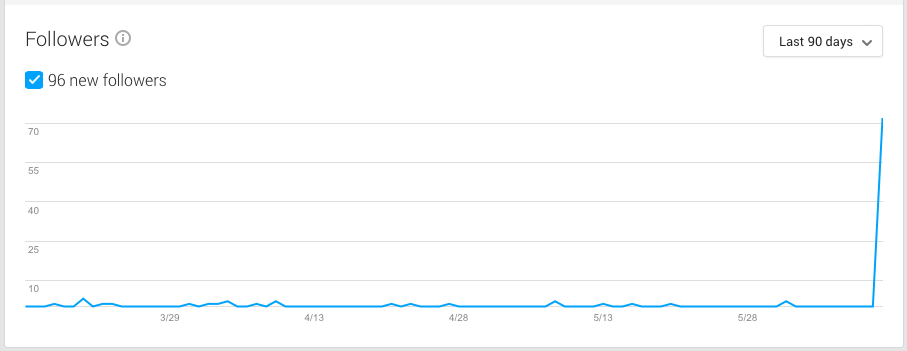
I say working in some degree because of all the listings I looked at, they all had a massive jump in followers on 6/11/14, the day My Business launched. And it happened to all of the visitors the listing had. So I expect this graph will become more useful over time than it is right now.
Regardless, this graph gives you the ability to track new followers, allowing you to see if a certain post garnered more followers so you can try to repeat those efforts to get more.
What We’d Like To See
Google has given us a lot of information here and will allow attorneys and their marketers the ability to better track and understand how their firm is being seen and interacted with in the SERPs and on Plus. There is just one feature that we would love to see integrated into the system, phone tracking.
Imagine how awesome it would be if you could use a tracking number in you’re my Business account and get the break down of how people saw your listing, how many people clicked for the website or directions, and how many people called directly from the listing. It’s a long shot but that one piece of information would allow a much better idea of ROI.
Putting it All Together
Including My Business Insights with Analytics and Webmaster Tools (and your Adwords reports if you are doing PPC) will allow you to have more complete vision of what is happening with your business in Google. It still has a few quirks to work out but overall the information provided by My Business Insights will enable you to make better decisions about where to put your focus and how to connect with more of your audience.
Nifty Marketing is a specialized digital marketing agency for law firms, focusing on SEO, PPC, website design, and content to generate more client leads, especially in competitive areas like criminal defense and personal injury law, using data-driven strategies and even AI optimization. They aim to make law firms “sexy” online, helping lawyers stand out with sophisticated branding and increased visibility.